
How to calculate employee turnover rate
November 12, 2026 Written by Cynthia Orduña


Compare providers
Download our outplacement comparison sheet

Request pricing
Compare our rates to other providers
Your HRIS shows you how many employees left your company last quarter. But what does that number tell you about employee turnover? To find out, you need more than a list of departures. You also need the right employee count and a consistent reporting period.
In this guide, you’ll learn how to calculate employee turnover rate accurately, avoid common calculation errors, and organize your data in Excel or Google Sheets.
What is an employee turnover rate?
Employee turnover rate measures how many employees leave a company compared to the average number of people working there during a certain period. This includes employees who choose to leave, such as those who resign, and employees who are let go through layoffs or terminations.
How do you calculate employee turnover rate?
To calculate employee turnover rate, divide the number of employees who left during a specific period by the average number of employees during that same period. Then, multiply the result by 100 to get a percentage.
Employee turnover rate formula: (Number of employees who left ÷ Average employee headcount) × 100
How to calculate average employee headcount
Average employee headcount formula: (Beginning headcount + Ending headcount) ÷ 2
Since your workforce may grow or shrink as people join and leave, using just one day’s headcount won’t always give you an accurate picture. Start by choosing the period you’re measuring. Then, pull your employee headcount from your HRIS or payroll system for the beginning and end of that period.
For example, if you’re calculating employee turnover for the second quarter of 2026, you would use:
- April 1, 2026: 120 employees at the beginning of the quarter
- June 30, 2026: 140 employees at the end of the quarter
Next, add both figures and divide by two: (120 + 140) ÷ 2 = 130 average number of employees
How to calculate a more accurate average headcount
If your company hires or loses employees frequently, look at your employee headcount throughout the reporting period instead of just the first and last day.
For example, for April 1 through June 30, 2026, you can pull the number of employees working at your company at the end of each month:
- April 30: 120 employees
- May 31: 145 employees
- June 30: 140 employees
Add those numbers together and divide by three: (120 + 145 + 140) ÷ 3 = 135 average number of employees
For even greater accuracy, use weekly or daily employee counts if your HR system provides them. With daily data, you would add the employee count for every day from April 1 through June 30 and divide by 91 days to account for changes throughout the quarter.
Why using the wrong headcount changes your turnover rate
Using only your starting or ending headcount can produce a lower or higher employee turnover rate than it actually is, especially if your company is growing or reducing staff.
For example, consider a company that started the year on January 1, 2026, with 100 employees and ended on December 31, 2026, with 150 employees. During those 12 months, 20 employees left.
| HEADCOUNT USED: | CALCULATION: | TURNOVER RATE: |
| Starting headcount (100) | (20 ÷ 100) × 100 | 20% |
| Ending headcount (150) | (20 ÷ 150) × 100 | 13.3% |
| Average headcount (125) | (20 ÷ 125) × 100 | 16% |
That’s a difference of nearly seven percentage points depending on which headcount you use. Using average headcount gives you a more representative calculation and helps keep your results consistent across reporting periods.
How to calculate monthly, quarterly, and annual employee turnover rates
The formula stays the same whether you’re measuring one month, three months, or an entire year. The important part is making sure that your employee departures and average headcount cover the same dates.
| REPORTING PERIOD: | EMPLOYEES WHO LEFT: | AVERAGE HEADCOUNT: | CALCULATION: | TURNOVER RATE: |
| Monthly (September 2026) | 8 | 200 | (8 ÷ 200) × 100 | 4% |
| Quarterly (July–September 2026) | 18 | 300 | (18 ÷ 300) × 100 | 6% |
| Annual (January–December 2026) | 48 | 400 | (48 ÷ 400) × 100 | 12% |
When comparing results, use equivalent reporting periods, such as one month against another month or one quarter against another quarter, rather than comparing annual and monthly turnover rates directly.
How to calculate voluntary and involuntary turnover rates
You can also calculate employee turnover separately based on whether employees chose to leave or were let go by the company. This helps HR teams understand how much of their turnover comes from employee resignations versus employer-initiated departures.
Start by pulling employee departure records from your HRIS for the reporting period. Organize the departures into two main categories: voluntary and involuntary. Then, group employees within each category by their reason for leaving.
| MAIN CATEGORY: | SUBCATEGORY (DEPARTURE REASON): |
| Voluntary turnover | Resignation for another job |
| Career change | |
| Personal or family reasons | |
| Retirement | |
| Involuntary turnover | Layoff or reduction in force |
| Performance-related termination | |
| Misconduct or policy violation | |
| Other employer-initiated termination |
The exact categories may vary depending on your HRIS and company policies. Make sure that each employee departure is counted only once and that you’re using consistent categories across reporting periods.
How to calculate voluntary turnover rate
Voluntary turnover rate formula: (Number of voluntary departures ÷ Average employee headcount) × 100
For example, suppose a company had an average of 250 employees in 2026, and 20 employees voluntarily left during that year: (20 ÷ 250) × 100 = 8% voluntary turnover rate
How to calculate involuntary turnover rate
Involuntary turnover rate formula: (Number of involuntary departures ÷ Average employee headcount) × 100
Using the same company, let’s say that another 10 employees were laid off or terminated during 2026: (10 ÷ 250) × 100 = 4% involuntary turnover rate
Together, the company’s voluntary and involuntary turnover rates equal 12%, representing 30 total departures during the year.
When reviewing these figures, keep the two categories separate in your HR reports. An increase in voluntary turnover may warrant a closer look at employee retention, while an increase in involuntary turnover may reflect staffing reductions or termination decisions.
It’s also worth examining how these categories affect each other. According to Careerminds’ 2026 Hidden Costs of Layoffs research, 40% of HR leaders reported that layoffs increased voluntary turnover, showing how employer-initiated departures can contribute to additional employee resignations.
Providing employees with support during workforce reductions can help organizations manage these transitions more thoughtfully. Click below to learn how Careerminds’ outplacement services can help your departing employees navigate their next career steps.
How to create a free employee turnover rate calculator in Excel or Google Sheets
You can create your own employee turnover rate calculator spreadsheet to track monthly, quarterly, or annual turnover without having to calculate each rate manually.
Step 1: Set up your spreadsheet
Open a blank spreadsheet and enter the following headings across the first row, starting in cell A1.

| COLUMN: | HEADING: |
| A | Reporting period |
| B | Beginning headcount |
| C | Ending headcount |
| D | Average headcount |
| E | Voluntary departures |
| F | Involuntary departures |
| G | Total departures |
| H | Turnover rate |
Step 2: Enter your employee data
In row 2, enter your reporting period in cell A2, followed by your beginning and ending employee counts in B2 and C2. Enter the number of voluntary departures in E2 and involuntary departures in F2.
Leave columns D, G, and H blank for now. These will be calculated automatically.

Step 3: Add the formulas
Copy and paste the following formulas into their corresponding cells:
- D2 (Average headcount): =(B2+C2)/2
- G2 (Total departures): =E2+F2
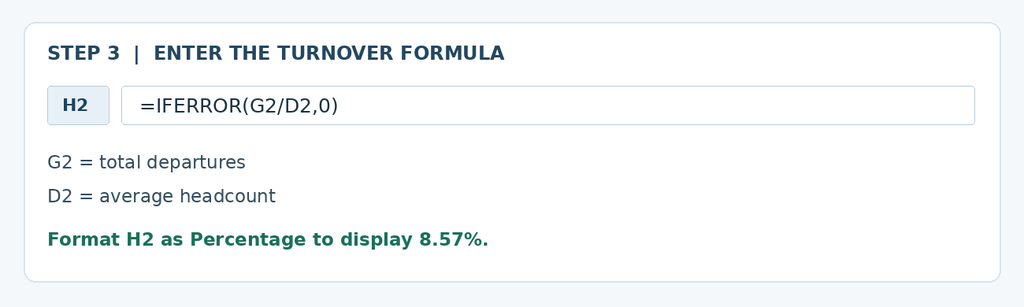
- H2 (Turnover rate): =IFERROR(G2/D2,0)
Select column H and change the number format to a percentage.
Step 4: Review your results
Once your calculator is set up, add a new row for each reporting period, then copy and paste the formulas from columns D, G, and H into the new rows. Excel or Google Sheets will automatically adjust the cell references.
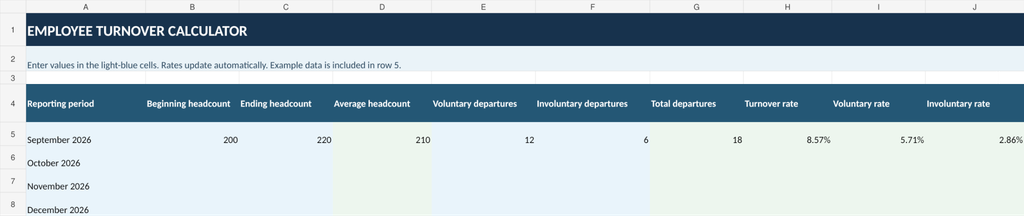
If you’re using monthly or daily employee counts to calculate a more precise average headcount, replace the formula in column D with your calculated average rather than using only beginning and ending headcount.
What should you do after calculating employee turnover?
Employee turnover rate shouldn’t be a number HR calculates once a year and files away. Tracking it consistently gives your organization a clearer picture of workforce changes and future talent requirements.
Whether your organization is focused on retaining employees, supporting career transitions, or managing workforce reductions, Careerminds offers tailored, results-driven career development, internal mobility, and outplacement solutions. Get in touch with our team to discuss how we can support your workforce needs.


bring the CHALLENGE.
wE have the SOLUTION.
Protect your brand and support your people through change. From career transition to leadership development, we bring clarity and care to the moments that matter most.